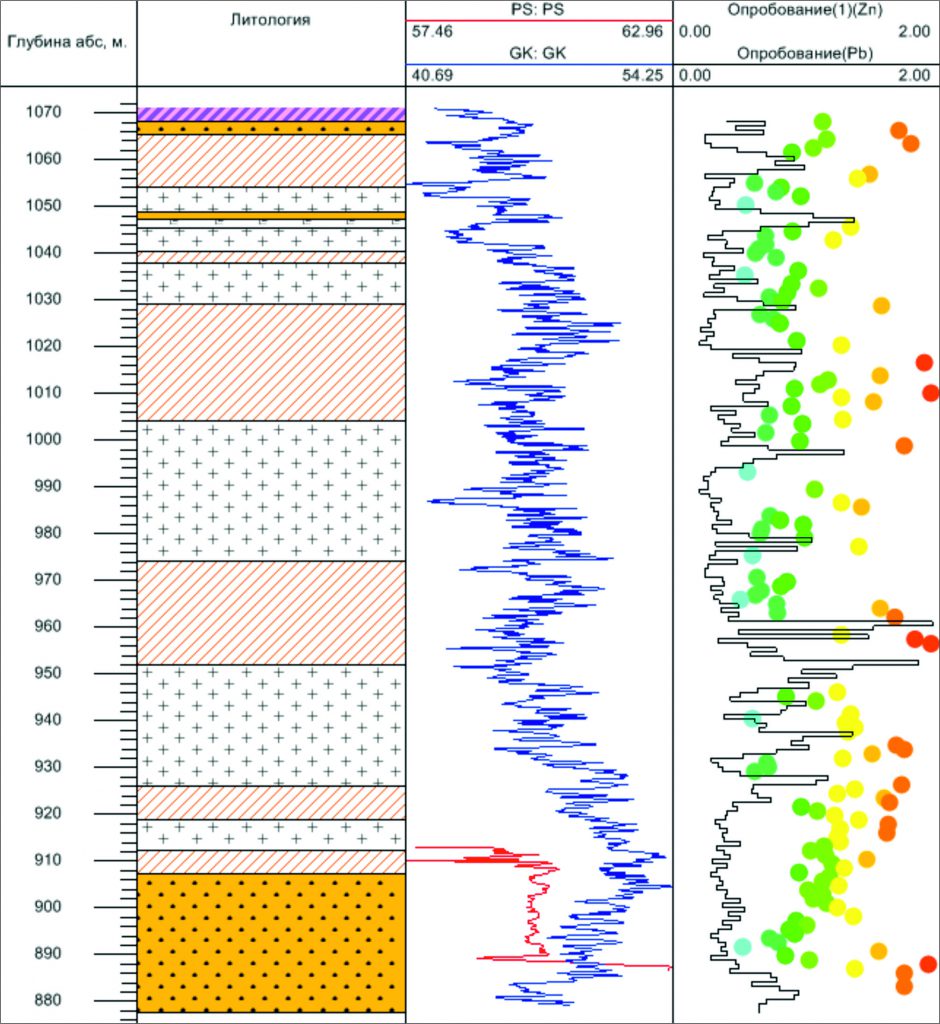
GIS INTEGRO Wells provides the storage and visualization of wells data. The tools allow to display and edit wells data on the well plot, on the profile. Wells visualization is performed in 2D and 3D scenes taking into account the inclination measurement.
Main capabilities
Storage of large volumes of heterogeneous wells data
Cluster editing of wells data
Wells sampling according to the user's criteria
Generation of well plots
Visualization and analysis of wells data on the digital map, on the profile and in 3D, including the allowance for the inclination measurement
Generation of correlation
Wells data are stored in the SQLite database. The major feature of the database consists in the fact that it requires no server and is provided on a disk as a single file which can be transferred from one computer to another as any other file. However it retains a great deal of the functionality of a "large" database.
For accelerated operation a part of the data, such as logging and documents, is stored outside the database in an adjoining catalogue, sorted by wells, but the main storage element in GIS INTEGRO is the database.
The database allows to store:
-
well datasheet,
-
well design,
-
drilling record,
-
inclination measurement,
-
borehole logs,
-
any kind of tabulated data with the reference to the depth, such as mark, interval, column,
-
text, graphic and tabulated documents including those with the reference to a well mark,
-
correlation.
Connection with a dictionary is possible for the text fields. The dictionary contains pairs of words "code — meaning" which are used for the substitution and display in the interface.
Visualization of well data
The main method of wells data visualization is well plot. It represents a set of well layers grouped by fields. Each layer can be designed individually depending of its type. It is possible to customize the order of drawing, visibility and position of the layers on the fields inside the well plot.

Modes of layer design
Each layer may have several possible designs depending of its type. The whole range of possibilities of corresponding style adjustment is available for each mode of display: the using of style library, the adjustment of own styles including the creation of own specks, line types, marks, and library of standard base of signs.
Design template
The "Design template" tool was created with the aim of the unification of data display on different scenes and for different wells. It allows to describe the structure of a well plot for the whole data array in the database. When a well plot is created according to a pattern depending of the scene type, the search of data is performed for each well. If the data are found, they are added to the well plot and designed according to the style selected. It is possible to select different variants of the search in the database with different priorities.
The patterns of design are applied for the creation of the scene of well plot and for the display of wells on the profile.
Visualization of data for a group of wells
The information from the database can be displayed on the scenes of GIS INTEGRO. The data are designed in the form of an ordinary layer containing a set of wells. It is possible to display all the wells from the database or a set of wells selected by some criterion.
For the 2D scene the information from the database can be represented as a dotted layer with the coordinates of wellheads or the coordinates of layer intersections of top and bottom of the selected layer. Inclination measurement is taken into account for the calculation of the layer intersections.

For the scene "2D profile" the information on the wells can be displayed in two modes. The first mode displays well plot, analogous to the wells scene, in the absolute depths, anchored to the wellhead coordinate projected to the profile.

The second mode displays the projection of wellbore with the allowance for the inclination measurement on the profile plane. Only one field of data is available in this mode.

On the 3D scene wells are displayed with regard for the trajectory.

Correlation
The module allows to work with several versions of the correlation. Well plots are used as bottom layers on the analogy with other modules. User can connect the borders of neighboring wells manually or they will be connected automatically if they have the same name. The borders and their connections are saved to the database and are used in subsequent work, for example for plane generation.


